Taste OS
Brand taste scoring across 5 dimensions. 20 pre-scored brands with interactive scorer.
Visit taste-os.netlify.app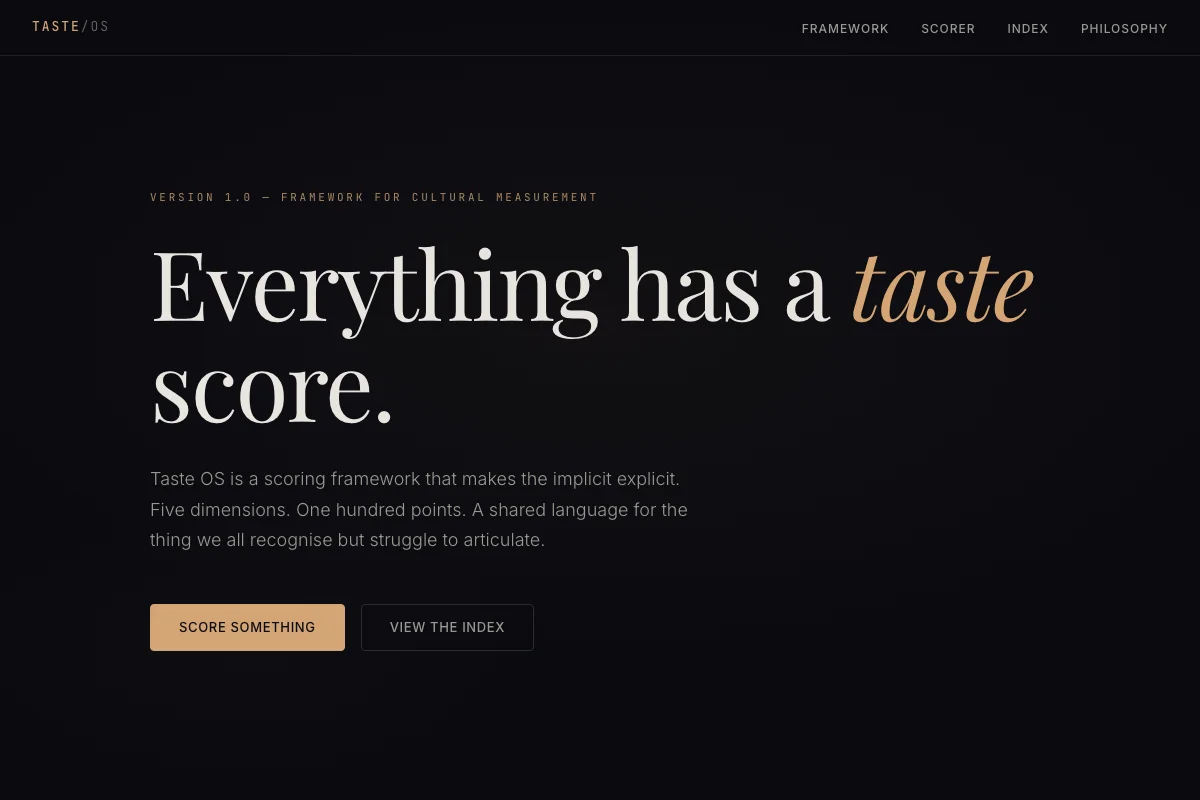
Measuring the unmeasurable
Taste is what's left when everyone has the same tools. This project creates a framework for something that's usually subjective: scoring brands on 5 dimensions (Craft, Originality, Cultural Weight, Point of View, Coherence), each worth 20 points, giving a total taste score out of 100. The question it answers: can you measure taste? Not perfectly, but the attempt reveals more than the number.
Five sliders, one score
Select a brand or score your own. 5 sliders, each 0-20. The radar chart shows the shape of your taste. 20 brands come pre-scored as benchmarks. Connected to CultureTerminal (cultural feed), Modern Retro (visual aesthetic lens), and the MR Score system (absurdity scoring).
"Everyone in advertising talks about taste. Nobody tries to measure it. I wanted to see what happens when you force a number onto something that's meant to be ineffable. Turns out, the arguments about the score are more interesting than the score itself."
Turning conviction into a system
Five dimensions, not three or ten. The hardest part was deciding what taste actually means when you break it down. I landed on Craft, Originality, Cultural Weight, Point of View, and Coherence. Five felt right: enough to be meaningful, few enough that each one matters. Three would be too vague. Ten would be overthinking it. Each dimension scores 0-20, so the total is always out of 100. Clean, simple, debatable. Exactly what I wanted.
Interactive sliders, not a form. The scorer had to feel like playing, not filling in a survey. Five sliders that update the radar chart in real time. You can see the shape of a brand's taste change as you move each one. That visual feedback is the whole point: taste has a shape, and different brands have different shapes. A high-Craft, low-Originality brand looks completely different to a high-POV, low-Coherence one.
20 pre-scored brands as anchors. If you just gave people an empty scorer, they'd have no frame of reference. The 20 benchmarks show what a 92 looks like versus a 61. They're conversation starters: "You gave Patagonia 88 and Supreme 74? Explain yourself." That's the whole point. Taste is subjective, but having a framework makes the disagreements more interesting.
Connected to the wider ecosystem. Taste OS doesn't exist in isolation. It connects to CultureTerminal for the cultural feed that informs the scores, Modern Retro for the visual aesthetic lens, and the MR Score system for absurdity scoring. Each project sees brands from a different angle. Together, they're building towards something bigger: a taste infrastructure.
Lessons from quantifying the subjective
Frameworks beat opinions. Before Taste OS, I'd say "that brand has great taste" and leave it there. Building a scoring system forced me to articulate what I actually mean by taste. Turns out, most of what I was calling taste was really coherence: does this brand feel like one person made every decision? Having a framework didn't kill the subjectivity. It made me better at defending it.
The radar chart was the breakthrough. I nearly just showed a number. But numbers flatten things. The radar chart shows the shape of taste, and that shape tells a story. A brand scoring 75 from balanced mediocrity looks completely different from a brand scoring 75 with extreme highs and lows. The visualisation is the insight, not the total.
People want to argue. The most common reaction to Taste OS is "you scored that wrong." That's not a failure, it's the entire point. The framework gives people a language to disagree with. Every argument about a score is really an argument about what taste means, and those are the best conversations.
"Taste is what's left when everyone has the same tools. When AI can make anything, what you choose to make is the only thing that matters."
Score brands on taste. 5 dimensions, 20 benchmarks, one number.
Visit Taste OS