I Built a Personal
Health OS
What 9 years of data, one afternoon, and an AI actually taught me about knowing yourself.
years of health data sitting on my phone.
3,172 days. I had never looked at any of it.
We're the most
quantified
humans in history.
Heart rate. Sleep cycles. Blood oxygen. Steps. Calories. Readiness scores. All of it collected. All of it siloed. None of it connected.
And we understand
almost none of it.
Four data silos.
Zero conversation.
So I built a dashboard
that connects all of it.
This is what it looks like.
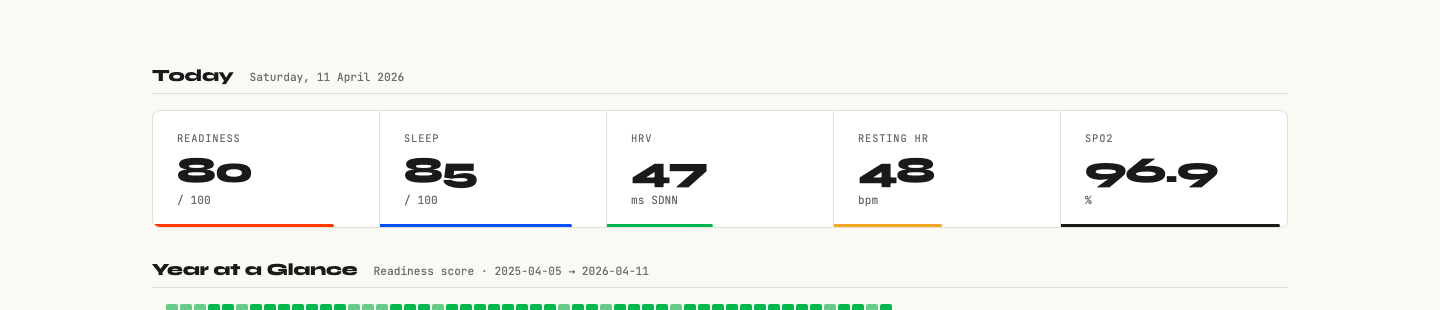
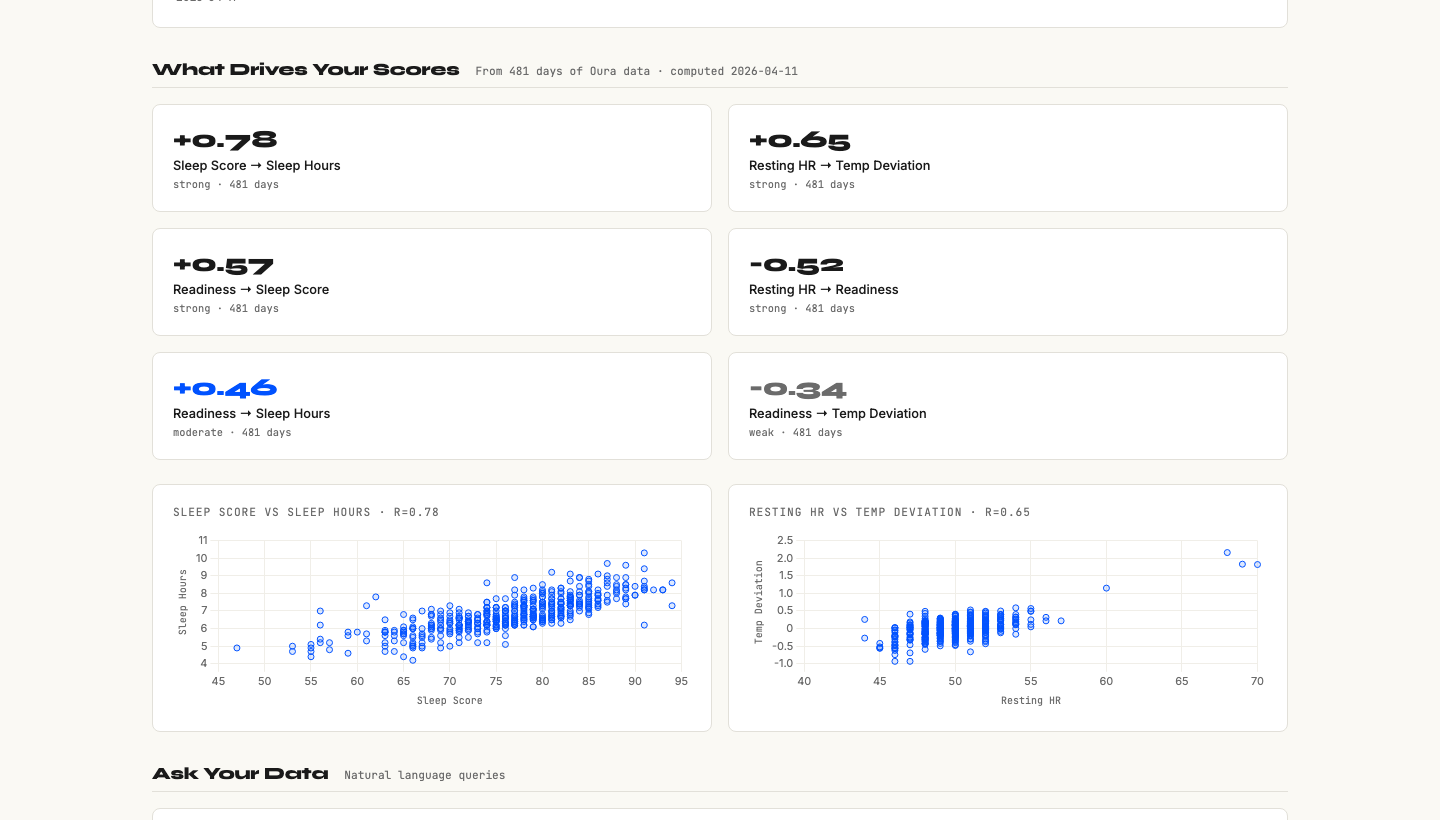
Not just data. Correlations.
Nine years. One dashboard.
Snapshots lie.
Trends tell the truth.
A single bad night's sleep looks catastrophic. A 90-day rolling average reveals whether you're recovering well or slowly declining. Doctors look at one reading. Dashboards show the pattern. The pattern is what matters.
Three things I didn't expect to find.
-
1My RHR is 48 bpm. That's athletic territory. I had no idea. Nine years of data and I'd never once looked at my resting heart rate trend.
-
2My biological age is 35. Chronological: 39. When it came back as 35, I didn't feel validated. I felt embarrassed that I'd had nine years of data on my phone and had never once thought to ask it a question.
-
3My cholesterol needed flagging. LDL 4.50 mmol/L. A non-fasting result that could be elevated by 0.5–1.0 mmol/L. Something to actually act on. I only spotted it by putting all the data together.
One number
changes the frame.
Twelve individual metrics are hard to hold in your head. But "biological age 35 at 39" is a story. It gives every other data point a reference frame. Context transforms numbers into meaning. That's the job of the dashboard.
Brief the machine
like a designer.
"My SpO2 is 96.9%. Should I be worried?" produces a generic answer. "I'm 39, non-smoker, Oura readiness averaging 74 over 30 days, SpO2 trending at 96.9% with no symptoms. Interpret this and tell me what to ask a GP." produces actionable intelligence. The brief quality determines the output quality.
Who does your
health data
actually serve?
From user
to owner.
Apple owns your health data. Oura owns yours. Google, Withings, Garmin -- they all own a piece of you. When you export it, parse it, and host your own dashboard, you own it. That shift is more significant than it sounds.
This applies even if
you're not technical.
-
📊Connect before you analyse. Your data is scattered. The first job is aggregation, not optimisation. Understanding your baseline beats chasing marginal gains.
-
🎯Ask better questions of your existing data. Every GP appointment is better with a 90-day trend chart. Every blood panel means more with context. AI doesn't replace the doctor. It helps you walk in prepared.
-
🔒Own it. The tools to do this exist. They're free. The only thing stopping you is not knowing it's possible.
This is not a weekend project
for engineers only.
The tools exist. AI handles the complexity. You just need to ask the right questions.
Agency,
not
optimisation.
The point isn't to become a biohacker. It's to stop being a passive consumer of your own data. You already have the information. Now you can use it.