"Mike's Links" is a solo Slack workspace I've been building since around 2019. No teammates, no notifications, no DMs. Just me, saving things I want to remember, organised by topic. It started as a replacement for browser bookmarks. It became something else entirely.
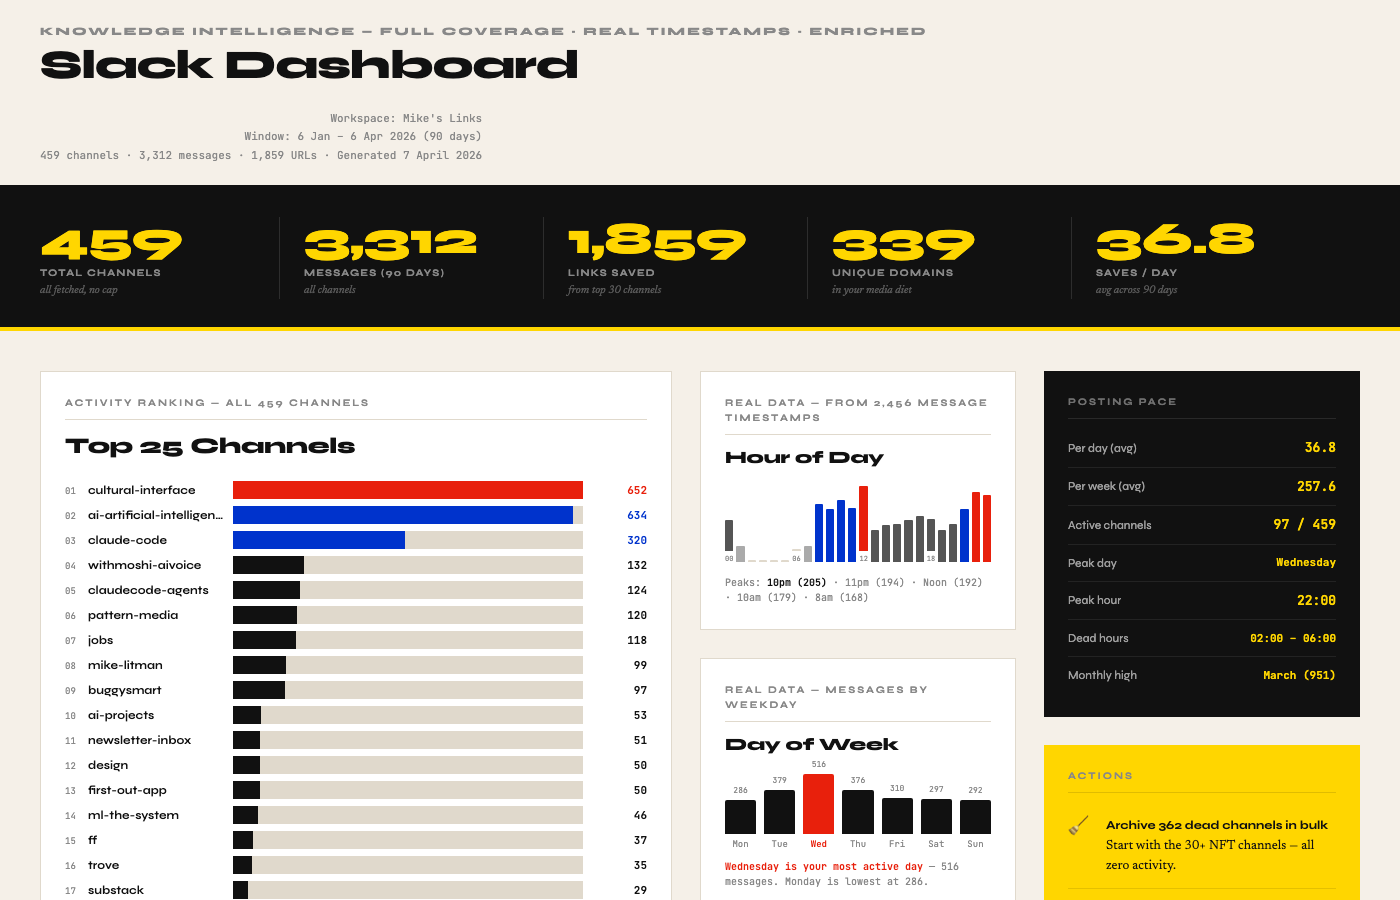
Last week I built a script to analyse the full workspace — all 459 channels, 90 days of activity, 1,859 URLs. What came back surprised me.
The numbers
459 channels. 97 active. 362 with nothing saved in 90 days.
That's 79% dormancy. At first this looks like failure — a workspace that's mostly dead. But I've started to think of it differently. Those 362 channels are an archaeological record. There's a #snapchat channel in there. A #clubhouse channel. Thirty-plus NFT channels from the Web3 phase of 2021–22: #nft-drops, #nft-wallets, #nft-yuga, #allthings-dao. They're all empty now. They show exactly where my attention was, and when it moved on.
The 97 active channels show where it is now.
3,312 messages in 90 days. 36.8 saves per day.
That's more than I expected. It means I'm consistently pulling things from the internet and filing them, every single day, including weekends.
What the top channels reveal
The #1 channel by activity is #cultural-interface. Not #ai-artificial-intelligence, which is #2. Not #jobs or #design or #tools.
Culture.
I find this significant. I've spent the last 18 months building AI-native products — a voice booking agent for restaurants, a buggy-friendly venue guide, an AI phone system, a queue research tool. AI is central to everything I do right now. And yet the thing I save most consistently, across 90 days and 652 messages, is cultural signals.
I think this tells me something true about how I work. I reach for culture first — signals, references, aesthetic ideas, shifts in taste. The technical implementation follows.
#claude-code is #3 with 320 messages. This is the channel where I log my Claude Code sessions, paste outputs, note what worked and what didn't. I've been using it as a personal practice journal for AI-assisted development. I didn't realise how consistently I was doing it until I saw the number. That channel is a case study in itself — a real-time record of what it looks like to learn an entirely new way of building software.
Where I actually read
The URL analysis was the most revealing part.
Of 1,859 external links saved across 90 days:
- Twitter/X: 631 links (34%)
- LinkedIn: 320 links (17%)
- Together: 951 links from two social platforms (51%)
Half of everything I save comes from my Twitter and LinkedIn feeds. Not from newsletters. Not from publications. From social platforms I'd reflexively describe as low-quality.
This is uncomfortable to sit with. It means my media diet — the thing I use to inform a professional practice in culture and AI — is primarily sourced from social media algorithms. The Guardian appeared 3 times. Substack, 23 times. BBC, 9 times.
I don't think this is entirely bad. The quality of what I save from X is genuinely high — I'm selective about who I follow and I use the save function deliberately. But seeing the ratio forces the question: am I reading deeply, or am I grazing?
When I work
The real timestamp data corrected something I thought I knew about myself.
I've always said Wednesday is a quiet day for me. I had it written into the notes I maintain about my own working patterns: "Slump: Wednesday." The data says the opposite. Wednesday is my most active day at 516 messages — 37% more than Monday, the lowest.
The hour-of-day pattern confirmed the night owl story: 10pm (205 messages) and 11pm (194) are the twin peaks. But noon is #3 with 192 — nearly equal to the late-night sessions. I apparently work in two distinct modes: the sharp-focus midnight session and the lunchtime catch-up.
Dead zone: 2am–6am. The only hours the workspace goes quiet.
The momentum story
The channels don't just track my interests — they track my output. Each new project I start generates a new channel, and it fills immediately: logs, reference links, notes, decisions. Several channels that didn't exist in January were among the most active by March. The workspace is a map of what I'm building as much as what I'm reading.
March was my biggest month (951 messages vs 800 in January). The pace is accelerating.
What this actually is
A workspace with 459 channels and 79% dormancy sounds like a mess. But I think it's something more interesting: a personal intelligence infrastructure, built incrementally, that maps the shape of my attention over time.
The active part is a research tool, a practice journal, a curation system, and a project log — all in one place. The dead part is history.
What I need to do now is connect the curation more directly to output. 1,859 curated links in 90 days is a significant body of material. Almost none of it has made it into a newsletter or a post. The #cultural-interface channel alone, with 652 saves, could fuel months of content.
The analysis was built using a Python script pulling from the Slack API with cursor pagination (the standard MCP tool caps at 100 channels — the full workspace has 459). The full interactive dashboard is at mikelitman.me/slack-dashboard. The presentation deck is at mikelitman.me/slack.